Found another one everyone should know about. The open source GPU debugger RenderDoc works just fine with vvvv and dx11. This can help to profile and debug shaders and your graphics performance and find bottlenecks. I might even prefer this one over the Nvidia one found in the last post. Its open source, the controls feel a bit more intuitive and it should also work with ATI cards:
The steps are pretty simple:
Download and install: https://renderdoc.org
Start the application and enter the vvvv instance you want to start:
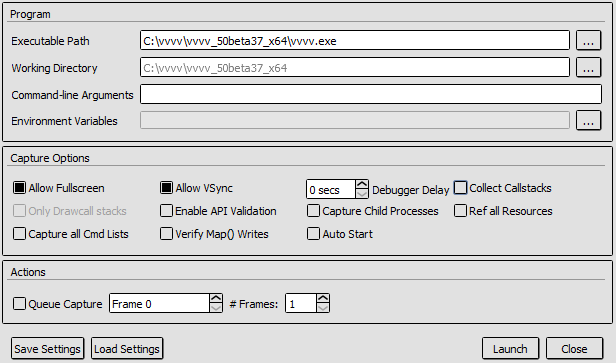
Press “Launch” and load any patch/scene with dx11 and you should see some debug HUD in the renderer
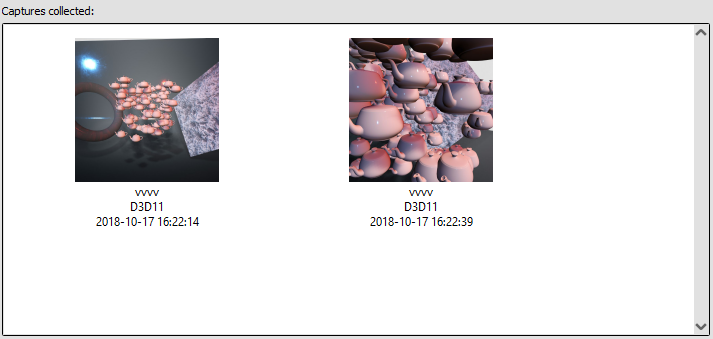
Press F12 or PRINT to capture the latest frame. Go back to RenderDoc and you should see a list of captured frames:
Double click or “Open…” a capture to inspect your frame like this:
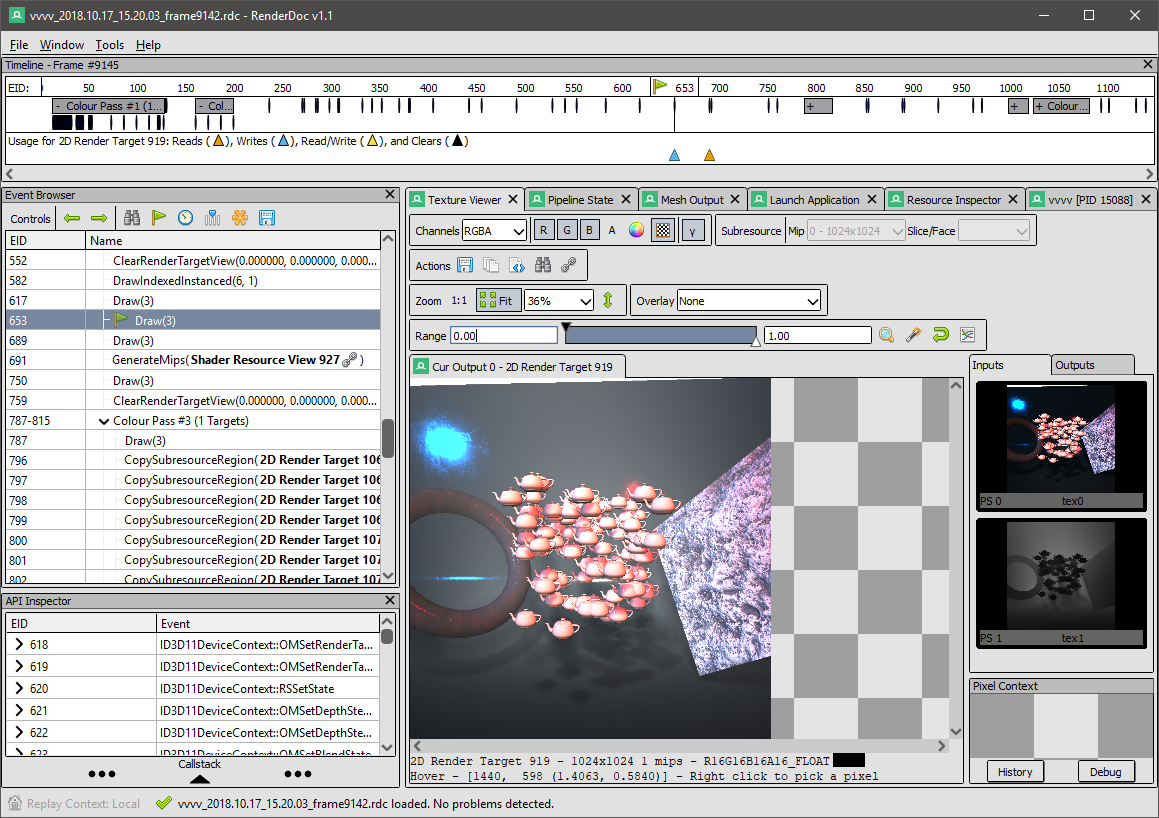
You can even right-click a pixel and ask for it’s history. E.g. which shaders did write into it and inspect the shader and shader resources:

RenderDoc was originally developed by Crytek for the Cryengine and was open sourced in 2014: https://www.cryengine.com/renderdoc
That’s it, now you know more. Yours, devvvvs
Comments:
Comments are no longer accepted for this post.