I am hosting a 4 day workshop on data visualization/sonification a the UPDATE festival in Liepāja Latvia.
In October 2018 I was diagnosed with Leukemia (B-ALL) han have been through treatment from that day it was diagnosed in 2018 until late April 2021 where I took the last Chemo pill. I an now cured and well again.
In Denmark you can access all your medical data and is automatically collected on the common “sundhedsplatform” that all citizens have access to, where they can see their own data.
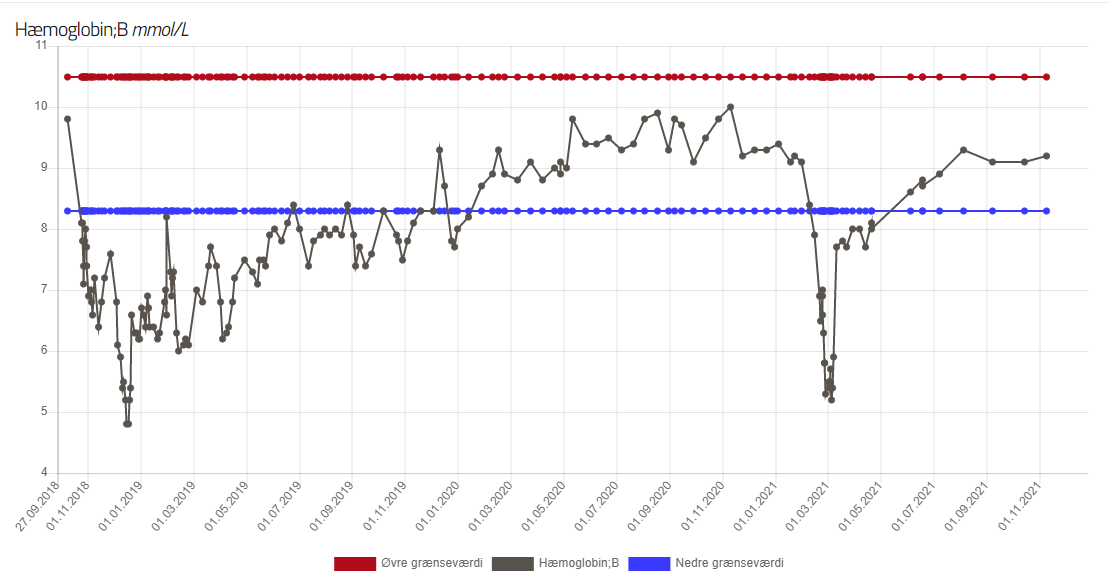
Seeing as a Patient in this treatment, the quite often daily blood tests are very important. After a while I could see some possibilities in using these data, it became obvious when I looked at the graph view of several of the blood parameters, here you can see Heamoglobin.
The workshop will take a subset of my blood data as starting point to see how it can be visualized/Sonified or whatever. It is of course also possible to use you own data if you have some interesting phenomenon you would like to explore.
The festival takes place in the physical world as well as online, so everyone can join. There are also other workshops and seminars that you can attend.
Disclaimer, as I have had chemo-brain for the most part of the past 3 years, the workshop is based on vvvv beta, I simply haven’t had the headspace to get into it yet. I will welcome it if you dive into gamma, then I will try to join in the best I can.
Comments:
Comments are no longer accepted for this post.